Solar Cycle Progression

Status
Not open for further replies.
M

michaelmozina

Guest
Now that the sun has finally gotten it's groove back we can talk about some of the typical processes that are observed throughout the solar cycle.

http://www.windows.ucar.edu/tour/link=/ ... tal=vocals

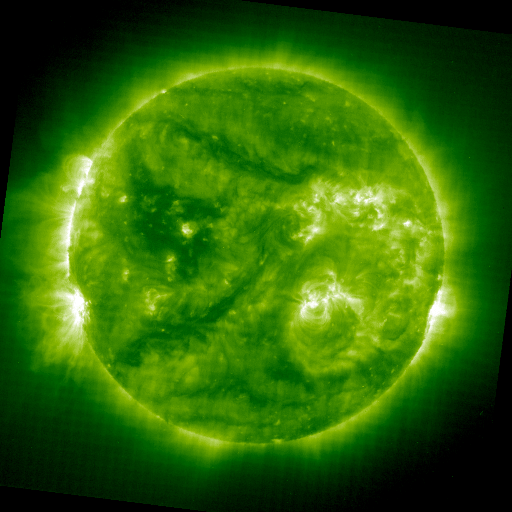
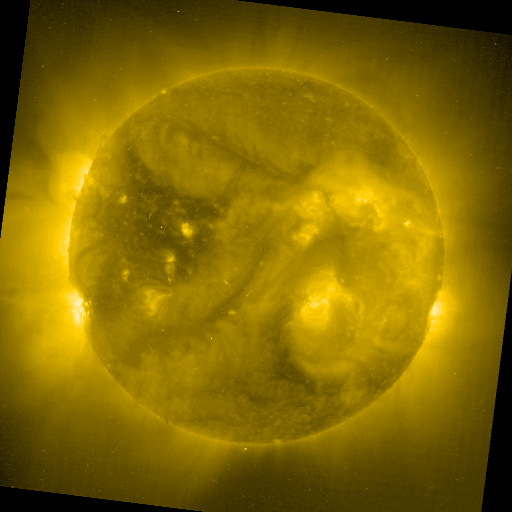
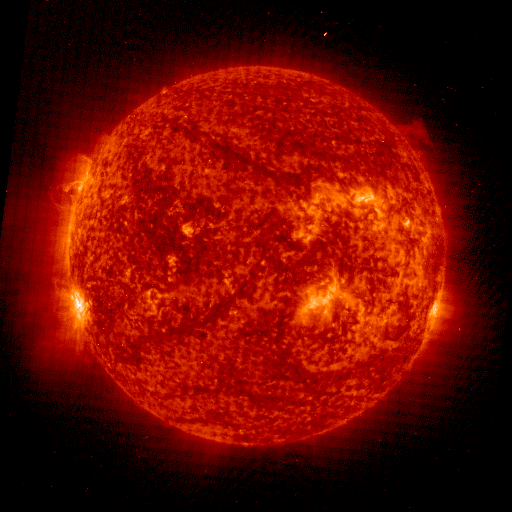
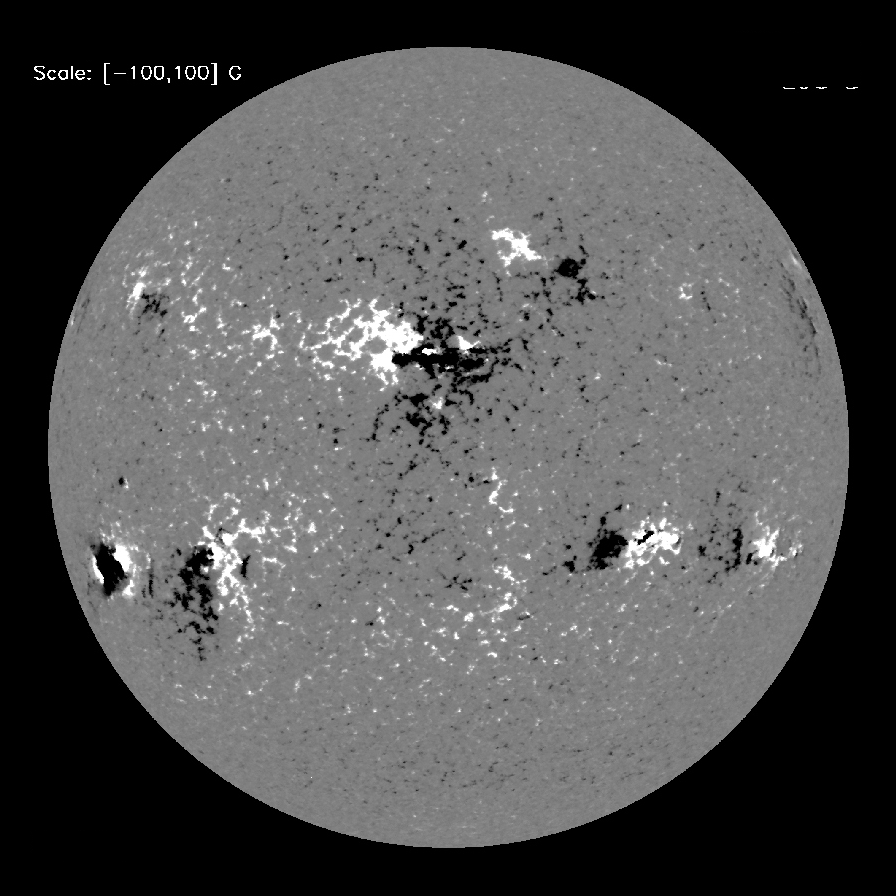
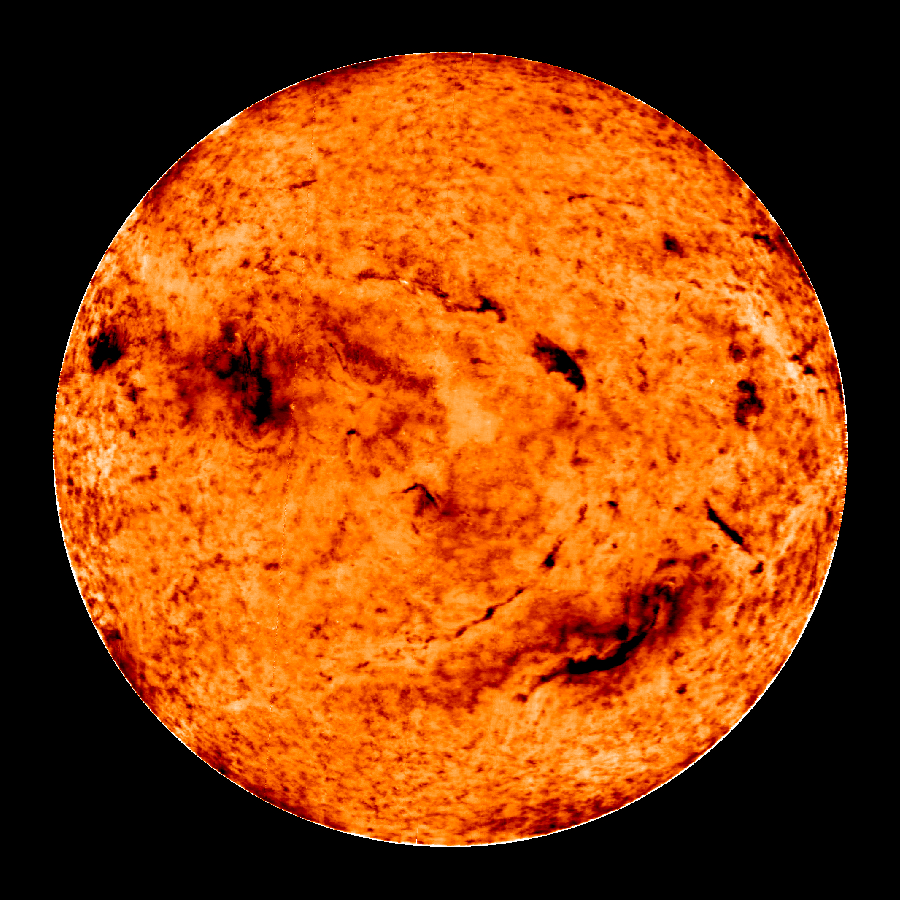
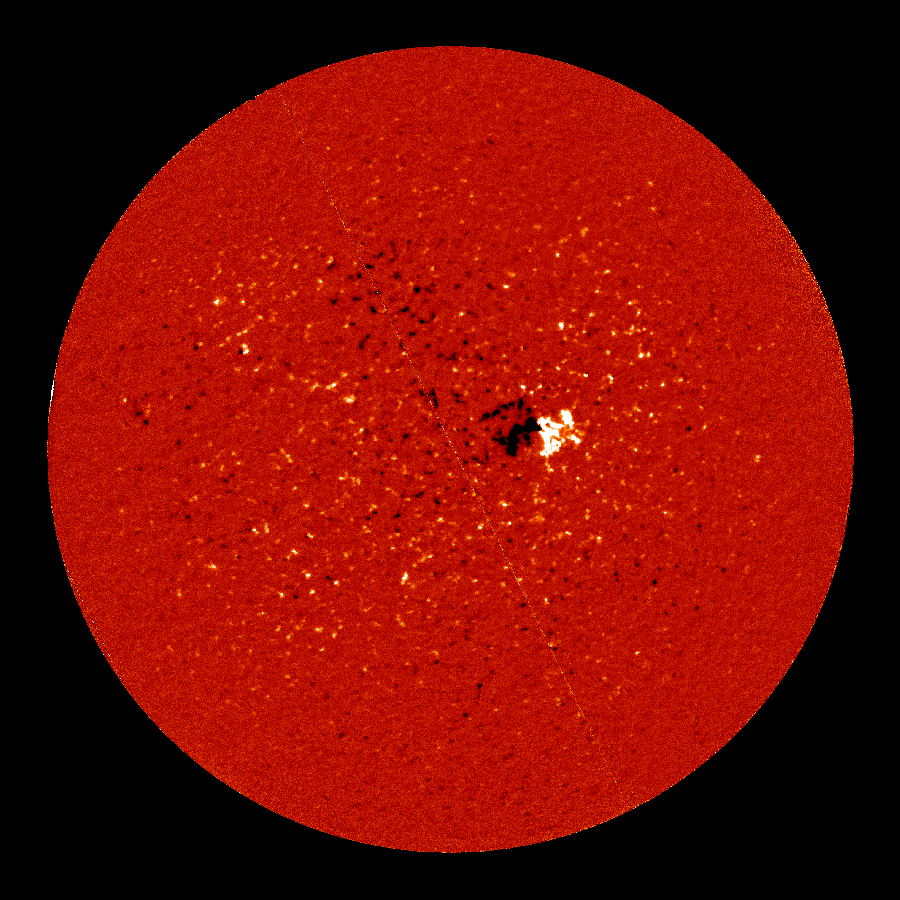
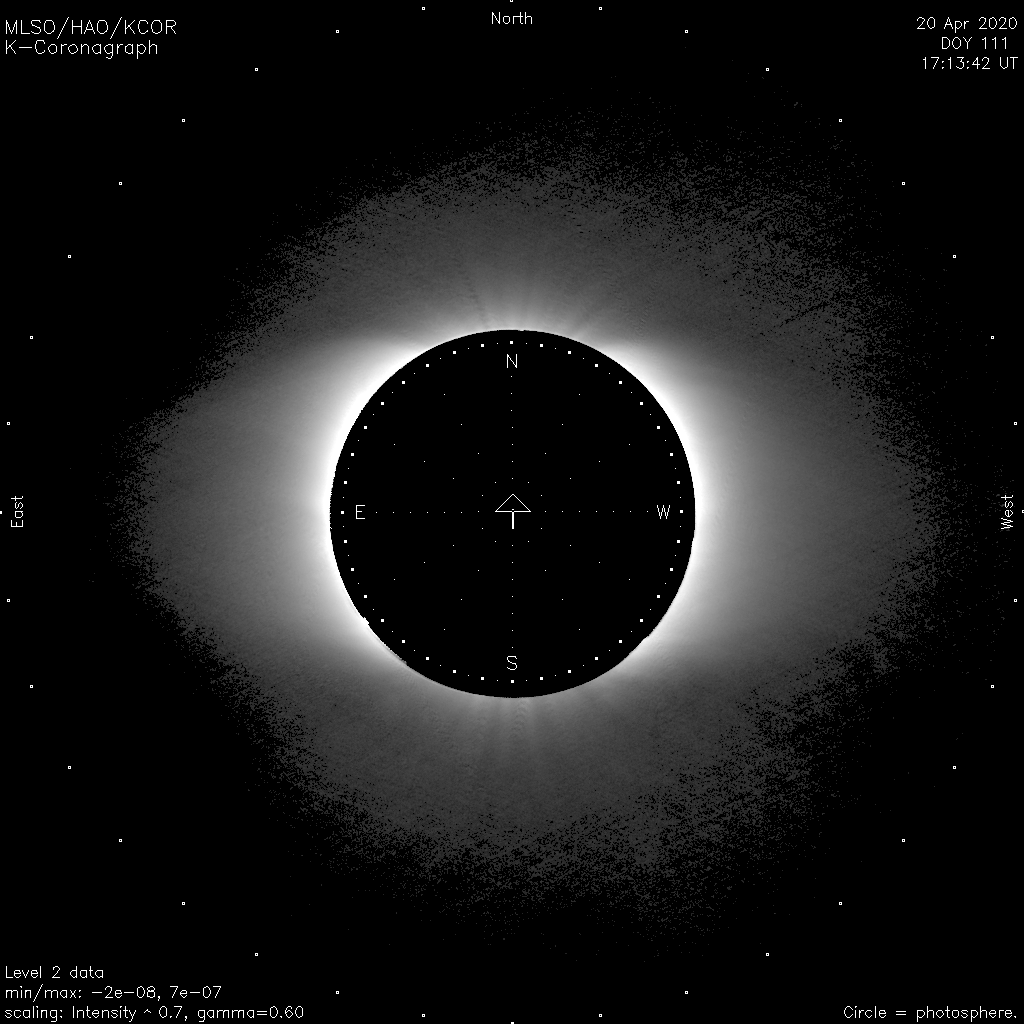
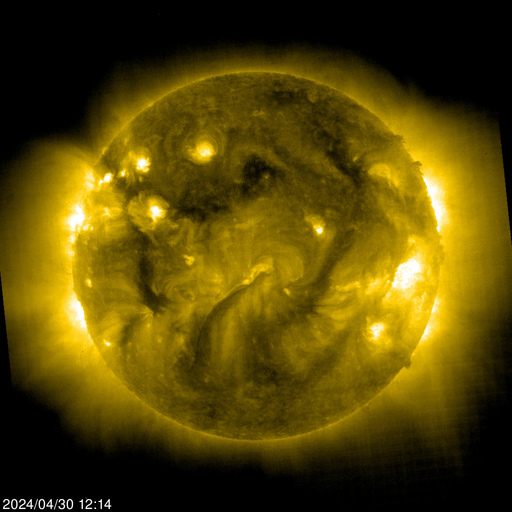
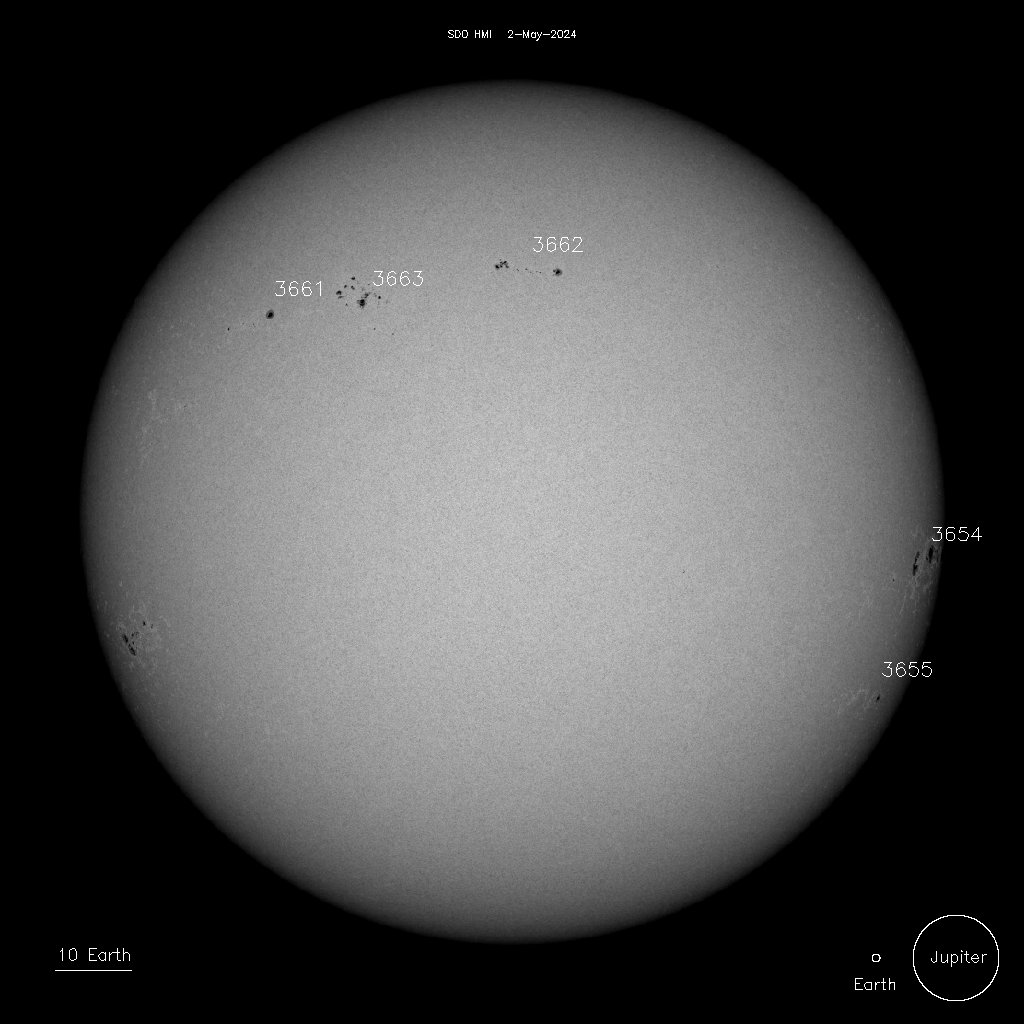
The "butterfly pattern" that plays out in the suns solar sunspot cycles, also (first) plays out in the higher energy wavelengths. STEREO has provided us with a more expanded view of the sun than we have with SOHO alone, so we can begin to see the formation of active regions in the northern and southern hemispheres and track them most of the way around the sun. There are now large active areas forming at a latitude of about 23 degrees in both the northern and southern hemispheres. Currently there are more persistent active regions in the northern hemisphere, but over time both hemispheres have been growing more active and will continue to become more active.

As the solar cycle progresses, we will observe these active regions seen in the 195A,171A, and 284A wavelengths slowly begin to move toward the equator. During the sun's most active sunspot phases, these active regions in the north and south begin to electromagnetically interact across the equator. As these active regions move down toward the equator over time, so will the sunspots that are linked to these active regions. It's a gradual change, but a noticeable one.

FYI, if you own an iPhone or iTouch, or iPad, you can download a free app called "3D Sun" that shows the 4 basic wavelengths of STEREO and allows you to rotate around the sun. It's a pretty cool app, although I miss the atmospheric elements that one can observe in the original images, and the "blending of images" at the seams appears to be a little 'fuzzy'. I understand that SDO images will be added to that app once the data from SDO comes online. It's free and well worth the download. The ability to rotate around the sun with your finger is quite cool, and makes it easy to see the emerging pattern of active regions forming in the northern and southern latitudes around 23 degrees at present.

http://itunes.apple.com/ca/app/3d-sun/id347089078?mt=8
 
H

harrycostas

Guest
G'day

Now you have made me spend time on that link.

Most interesting.
 
M

MeteorWayne

Guest
http://science.nasa.gov/headlines/y2010 ... orbelt.htm

March 12, 2010: What in the world is the sun up to now?

In today's issue of Science, NASA solar physicist David Hathaway reports that the top of the sun's Great Conveyor Belt has been running at record-high speeds for the past five years.

I believe this could explain the unusually deep solar minimum we've been experiencing," says Hathaway. "The high speed of the conveyor belt challenges existing models of the solar cycle and it has forced us back to the drawing board for new ideas."

The Great Conveyor Belt is a massive circulating current of fire (hot plasma) within the sun. It has two branches, north and south, each taking about 40 years to complete one circuit. Researchers believe the turning of the belt controls the sunspot cycle.

The speed-up was surprising on two levels.

First, it coincided with the deepest solar minimum in nearly 100 years, contradicting models that say a fast-moving belt should boost sunspot production. The basic idea is that the belt sweeps up magnetic fields from the sun's surface and drags them down to the sun's inner dynamo. There the fields are amplified to form the underpinnings of new sunspots. A fast-moving belt should accelerate this process.

So where have all the sunspots been? The solar minimum of 2008-2009 was unusually deep and now the sun appears to be on the verge of a weak solar cycle.

Instead of boosting sunspots, Hathaway believes that a fast-moving Conveyor Belt can instead suppress them "by counteracting magnetic diffusion at the sun's equator." He describes the process in detail in Science ("Variations in the Sun's Meridional Flow over a Solar Cycle," 12 March 2010, v327, 1350-1352).

(Looks like another wait by the mailbox :) -MW)
 
H

harrycostas

Guest
G'day

The conveyor belts are part of the overal cyle and cycles of the Sun with the Core being the main player. The N and S poles keep in balance the conveyor belts and explains the northern and sounthern sunspot belts.

Once we find the make up of the core we can then determine its dynamics.
 
E

EarthlingX

Guest
Current auto updated solar images ( click to enbigger (not really large) ) :
Solar Data Analysis Center

( bigger versions of the above images from Current solar images on SDAC )

and

http://spaceweather.com/ ---------- http://solarmonitor.org/

n3kl.org :
Solar X-rays:
status.gif

Geomagnetic Field:
kpstatus.gif
 
H

harrycostas

Guest
G'day Earthling X


Notice the sunspot belt to upper .

The lower belt is not so noticeable
 
E

EarthlingX

Guest
harrycostas":8efbh018 said:
G'day Earthling X


Notice the sunspot belt to upper .

The lower belt is not so noticeable
Yes, yesterday was Geomagnetic Field 'Unsettled', as i write this, it's 'quiet'.

n3kl.org :
Solar X-rays:
status.gif

Geomagnetic Field:
kpstatus.gif


There are three active regions in the upper now, yesterday it was only one in the upper part.

Bigger versions of above images from SOHO :


Satellite environment from nkl3.org :


Updated text, not image
Wiki : Sun
The Sun is the star at the center of the Solar System.

Latest from NASA :
Solar 'Current of Fire' Speeds Up
March 12, 2010: What in the world is the sun up to now?

In today's issue of Science, NASA solar physicist David Hathaway reports that the top of the sun's Great Conveyor Belt has been running at record-high speeds for the past five years.

"I believe this could explain the unusually deep solar minimum we've been experiencing," says Hathaway. "The high speed of the conveyor belt challenges existing models of the solar cycle and it has forced us back to the drawing board for new ideas."
conveyorbelt_med.jpg

Looks somehow related, from SolarMonitor, acitve region 11056, 2010.03.18 :
seit_00195_ar_11056_20100317_231210.png


Image of the day (2010.03.20) , from Earth Observatory :

Solar Flare and Coronal Mass Ejection


On March 20, 2010, spring equinox, NASA also celebrates Sun-Earth Day. The day is comprised of educational events and activities, including a live web cast with NASA solar scientists and space weather experts. In 2010, Sun-Earth Day focuses on magnetic storms, which bombard Earth with charged particles that can interfere with electronics systems and satellites. This image, captured by NASA’s Solar Terrestrial Relations Observatory (STEREO) Ahead spacecraft on February 12, 2010, shows one such storm (albeit a very small one) brewing in two active areas of the Sun.

Threads :
SOHO Comets/Asteroids/Planets

Spectactular Coronal Mass Ejection (CME) happened on 1st Feb

Both worth checking.
 
C

csmyth3025

Guest
I don't know if this post is related to a thread on Solar Cycle Progression, but I'm wondering is these current observations shed any light on the Maunder Minimum of the 17th century. I'm also wondering if the Maunder Minimum and the Little Ice Age were entirely separate phenomena that just coincidentally happened at roughly the same period of time or if there is any serious scientific speculation that the two are related in some way.

Is there any evidence that events such as the Maunder Minimum may be a recurring (but long-cycle) feature of the Sun's "weather"?

Chris
 
E

EarthlingX

Guest
Some background to chew on :

Wiki : Maunder Minimum
The Maunder Minimum (also known as the prolonged sunspot minimum) is the name used for the period roughly spanning 1645 to 1715 by John A. Eddy in a landmark 1976 paper published in Science titled "The Maunder Minimum",[1] when sunspots became exceedingly rare, as noted by solar observers of the time.

The Maunder minimum in a 400 year history of sunspot numbers

Wiki : Little Ice Age
The Little Ice Age (LIA) was a period of cooling that occurred after a warmer era known as the Medieval Warm Period.


The reconstructed depth of the Little Ice Age varies between different studies (anomalies shown are from the 1950-80 reference period).

wiki : Solar Variation
Solar variation refers here to changes in the amount of total solar radiation and its spectral distribution. There are periodic components to these variations, the principal one being the 11-year solar cycle (or sunspot cycle), as well as aperiodic fluctuations.[1] Solar activity has been measured by satellites during recent decades and estimated using 'proxy' variables in prior times. Scientists studying climate change are interested in understanding the effects of variations in the total and spectral solar irradiance on the Earth and its climate.
 
M

MeteorWayne

Guest
Well, these current (that's a pun you made, you know :) ) observations may be related...unfortunately the current models of the sun lack sufficient data to really tell. That is one purpose of SDO (See the SDO thread in M&L), which will soon begin dumping torrents of data about the suns interior to us.

The case for the Maunder Minimum and the Little Ice age being related is pretty strong. Lack of sunspots correlates with lower solar energy output. It may have declined by 0.3% or so (off the top of my head and memory) during that period...that's a lot. The normal range between solar min and max is about 0.1%, though shorter periods can have larger variations

There's no evidence that the Maunder minimum is a recurring feature, but there's no evidence it's not either. We simply haven't been monitoring sunspots in detail for long enough. For example, this is cycle 24, so with an 11 year half cycle (the whole cycle is actually 22 years; each max is of reverse polarity) 11 x 24 = 264 years of records sufficient to establish the 11 year halfcycle, back to the mid 1700s. The Maunder minimum occurred before that when records were less relaible, but suffiecient to confirm it's existance. That's not enough to determine anything about "long term". Remember the sun is 4.5 billion years old, 264 years is a sliver at the tail end of it's history.
MW

Edit: a useful link:

http://en.wikipedia.org/wiki/Sunspot_cycle
 
C

csmyth3025

Guest
The pun was purely serendipitous, I assure you. If I was that witty I'd have my own talk show on TV.

Chris
 
H

harrycostas

Guest
G'day Earthling

That post was fantastic.

Good on ya mate.

Down under we do not see the Sun that much because we stand on our heads.
That was joke just incase people from the North read it.
 
E

EarthlingX

Guest
harrycostas":3cbkip6u said:
G'day Earthling

That post was fantastic.

Good on ya mate.
Cheers mate, glad you like it :)
harrycostas":3cbkip6u said:
Down under we do not see the Sun that much because we stand on our heads.
That was joke just incase people from the North read it.
I do that a lot around here, maybe i'm in the wrong place ? Perhaps, there's still a chance fer me, thought i was a no-hoper.
Oh, how was this very OtT ..

Ok, back to the topic :

n3kl.org :
Solar X-rays:
status.gif

Geomagnetic Field:
kpstatus.gif


Satellite environment :
noaa_satenv.gif


Space Weather :
North :
pmapN.gif

South :
pmapS.gif


Current auto updated solar images ( click to enbigger (not really large) ) :
Solar Data Analysis Center

( bigger versions of the above images from Current solar images on SDAC )

- updated images from SOHO :


I updated the post about conveyor belt with some more links, images and info.

You can quote this post, or any other, and try messing with the images, if you don't like what you see, or have some specific requirements. More of the same image, from the same source, will not hurt performance, since it is already in a couple of caches on the way to your screen. Those images are not on the SDC, of course, just a reminder. It is different with images, which have not yet loaded, they have to go through the caches first, same-old ..
 
H

harrycostas

Guest
G'day

Earthling said

I do that a lot around here, maybe i'm in the wrong place ? Perhaps, there's still a chance fer me, thought i was a no-hoper.
Oh, how was this very OtT ..

The Hot!!!!

This year has been very Hot and wet.
 
E

EarthlingX

Guest
harrycostas":xip4dosq said:
G'day

Earthling said

I do that a lot around here, maybe i'm in the wrong place ? Perhaps, there's still a chance fer me, thought i was a no-hoper.
Oh, how was this very OtT ..

The Hot!!!!

This year has been very Hot and wet.
It might have been a bit out of the average couple past years, but i would search closer for Earth weather variations, like here :

Wiki : El Niño-Southern Oscillation
El Niño-Southern Oscillation, often called simply ENSO, is a climate pattern that occurs across the tropical Pacific Ocean on average every five years, but over a period which varies from three to seven years, and is therefore, widely and significantly, known as "quasi-periodic." ENSO is best-known for its association with floods, droughts and other weather disturbances in many regions of the world, which vary with each event. Developing countries dependent upon agriculture and fishing, particularly those bordering the Pacific Ocean, are the most affected.

Related, from NASA, Earth Observatory, image of the day, 2010.03.21 :

Kelvin Wave Renews El Niño (more image options with the article, including video)
The climate pattern known as the El Niño-Southern Oscillation, or “ENSO” for short, is the biggest cause of large-scale climate variability in the tropics. During an El Niño episode, the central and eastern Pacific Ocean are warmer than normal. The above-normal sea surface temperatures are maintained by gentle but giant waves of warm water that slosh across the Pacific from Indonesia toward South America.
globalssha_jas_2010.jpg

This is probably just a beginning of a list, including most relevant short term influences, caused by, or at least related to, long term trends, such as the one discussed.
 
M

MeteorWayne

Guest
Mod Hat On ***

Please let's stick to the solar cycle in this thread. ENSO discussion belongs in the Forces of Nature forum..

MW
 
H

harrycostas

Guest
G'day

MeteorWayne
Mod Hat On ***
Please let's stick to the solar cycle in this thread. ENSO discussion belongs in the Forces of Nature forum..
MW

I disagree, the direct solar cycle affects the cycles of the Earth and therfore the correllation fits the bill.

Earthling said

It might have been a bit out of the average couple past years, but i would search closer for Earth weather variations, like here :

Wiki : El Niño-Southern Oscillation


I have read that link and the science evidence that supports Global warming based on CO^2 and there seems to be a minimal effect.

It comes back to the Solar Cycle and it's influence over the Earth based on deep ice fossil records.
 
3

3488

Guest
***MOD HAT ON***

Meteorwayne asked for this topic to remain on the subject of SOLAR CYCLE PROGRESSION.

Talk of El Nino, La Nina, Solar induced Global Warming & solar induced Climate Change, etc do belong in Forces of Nature.

This topic is about the SUN, NOT the Earth.

Deliberate defiance of MODERATOR instructions will lead to sanctions up to & including banning.

***MOD HAT OFF***

Andrew Brown.
 
E

EarthlingX

Guest
Yo folks, Sun's Xrays active today !

Current auto updated solar images ( click to enbigger (not really large) ) :
Solar Data Analysis Center

( bigger versions of the above images from Current solar images on SDAC )

and
n3kl.org :
Solar X-rays:
status.gif

Geomagnetic Field:
kpstatus.gif

or :
It has been totally silent, for a week, i think, no yellows, all green ..

Live satellite environment and X-Ray flux :


Magnetometer and Estimated Kp Index


Electron Flux and GOES 8 Proton Flux


Solar wind speed (SOHO) :
sws_dial_4.png


Auroral oval from SpaceWeather :
Europe - USA - New Zealand - Antarctica


Live images from SOHO:
(click to enlarge to 1024)

MDI - Sunspots - More 512×512 - http://www.solarmonitor.org/


EIT 304 - More 512×512


EIT 171 - More 512×512


EIT 195 - More 512×512


EIT 284 - More 512×512


MDI Continuum - More 512x512


LASCO C2 - More 512x512


LASCO C3 - More 512x512


And, i think, Sun has made a half rotation, relative to Earth, since the beginning of this thread, or very close.

This region : http://www.solarmonitor.org/region.php? ... gion=11056

was on the left side, with a picture of the day too, right ?

http://www.solarmonitor.org/region.php? ... gion=11056

http://www.solarmonitor.org/index.php?date=20100318
 
E

EarthlingX

Guest
From news.discovery.com : The Sun Points Radio-Active Sunspot at Earth
Analysis by Ian O'Neill | Mon Mar 29, 2010 04:46 PM ET

As the sun continues to ramp up in activity after a long period in the doldrums, solar astronomers have been treated to an up-tick in sunspot numbers, solar prominences and flares.

And now, radio astronomers have joined the fun, listening to the roar of a particularly "noisy" sunspot currently pointing in our direction.

Not all sunspots emit strong radio emissions, but sunspot 1057 certainly isn't shy. As reported by SpaceWeather.com, a radio astronomer in New Mexico received a mix of Type III and Type V radio emissions:

"It was sunspot 1057. All day long it had been producing small radio bursts around 21 MHz. Then, at 1813 UT, it let loose a big one. The burst only lasted a minute, but it saturated the radios." --Thomas Ashcraft, radio astronomer.
But why are these radio bursts important? Primarily, they give solar physicists an idea about the extreme magnetic fields and plasma conditions inside sunspots. Sunspots are produced when vast magnetic fields push through the surface of the sun, pushing the uppermost layer of the sun's body (the photosphere) away, exposing the cooler (thus darker) solar interior.

Active region 11057 on 2010.03.30 : http://www.solarmonitor.org/region.php? ... gion=11057


Two more active regions, on 2010.03.30 :
 
Status
Not open for further replies.