Is time dilation due to Einstein or Physical Nature

Page 2 - Seeking answers about space? Join the Space community: the premier source of space exploration, innovation, and astronomy news, chronicling (and celebrating) humanity's ongoing expansion across the final frontier.
Jun 11, 2023
181
8
85
Visit site
Every emission of a moving emitter is a different frequency. And the change in that frequency only comes from the off time while keeping a constant on time.

I hardly think that kind a changing waveform can be described with sine waves. Sine waves are symmetrical. This change is not. It would be interesting to see the FFT of any frequency 50% duty ramp.

I would think that sines waves would only work with 50% duty cycles. But I have not played with this one.

One might describe one emission with sine waves, but not a sequence of them. Each emission could be unique. Especially if the detector is changing velocity. My conjecture so far was just for moving emission.

A moving detector also has an effect.

The only evidence I can offer for duty cycle light is a baled hayfield.

Some ponder in tubs and some ponder in hayfields.
Classical Motion Said): Every emission of a moving emitter is a different frequency.

Well, I have a problem with absolutes especially when the context is not given!!

By a moving emitter do you mean the sound waves from the siren of an ambulance moving away from you and the associated Doppler effect reducing the shrill of the siren sound coming to you??

Talk more, soon. Have a great day.
 
Sorry I misstated that. An accelerating emitter has a different frequency on each emission........a chirp emission.

The frequency is defined as one on time and one off time. This is duty cycle frequency.

In a hay field, if the tractor is going at a constant velocity, The frequency would be the length of the bale....plus the space to the next bale.

Therefore.....if tractor is at same speed, space between bales will be equal. AND can be adjusted and set by tractor speed. If tractor goes slow, little space between bales. if tractor goes fast, large space between bales.

IF the tractor is accelerating.....each sequential space will be longer.......and if tractor is decelerating....each sequential space will be shorter. Chirping.
 
Jun 11, 2023
181
8
85
Visit site
"Except for the global nature of the 26 second Earth Crust rise and fall "

The reference I provided explains that there is a coresponding rise and fall halfway around the world at the antipode, so it is, in fact, global.


"Billslugg, as you can see, the 26 second pulsation issue remains unresolved"

In all cases, we consider the latest explanation by a PhD level scientist associated with a university and operating in their field to be the "current best explanation". We can ignore the people in the cheap seats.


Solar Quasi Periodic Pulsations (QPPs) have been explained here. They are oscillations of a current sheet within a CME.

Billslugg Quoted Adoni): "Except for the global nature of the 26 second Earth Crust rise and fall " challenge to his comment!!

Billslugg agrees): “The reference I provided explains that there is a corresponding rise and fall halfway around the world at the antipode, so it (the 26 second Earth Crust rise and fall in a “harmonic” “Fourier sine wave” fashion) is, in fact, global!!” But fails to identify which one of the myriads of Earth antipodes is referenced.

Antipode per Wiki): “In geography, the antipode of any spot on Earth is the point on Earth's to each other are situated such that a straight line connecting the two would pass through Earth's center. Antipodal points are as far away from each other as possible. The North and South Poles are antipodes of each other.”

Adoni’s Quote): "Billslugg, as you can see, the 26 second pulsation issue remains unresolved" is countered and dismissed with “In all cases, we consider the latest explanation by a PhD level scientist associated with a university and operating in their field to be the "current best explanation". We can ignore the people in the cheap seats.

Is Adoni given to be in a “Cheap Seat”?? and his novel original logical concepts, postulates and theories with given factual backups given to be nonstarters because he does not have a PhD??

And Billslugg reference is to Solar Quasi-periodic pulsations (QPPs) which have some explanation as I noted in my post): “And don’t forget that our Sun is given to pulsate mysteriously exactly every 5 minutes and 34 seconds?? (Some explanation is offered {by physicists}!!)” and does not dismiss nor apply to my discussion of the Earth’s 26 second Quasi-periodic pulsations (QPPs)!!

And Thanks, Billslugg, for bringing up a reference proving our Sun’s 5 minute and 34 second (QPP) pulsation is still under investigation!!):
Microwave imaging of quasi-periodic pulsations at flare current sheet - Nature Communications.”
“Quasi-periodic pulsations (QPPs) are frequently detected in solar and stellar flares, but the underlying physical mechanisms are still to be ascertained. Here, the authors show microwave QPPs during a solar flare originating from quasi-periodic magnetic reconnection at the flare current sheet.”

We have much to discuss?? Do all stars and planets pulsate based on the available given facts before us?? Have I been truthful and forthright about given facts?? Do my arguments and theories based on given facts make sense??

Talk more, soon?? Have a great day!!

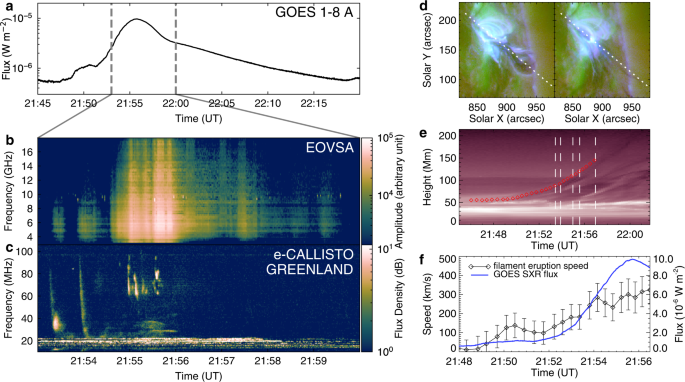
PS): Billslugg’s Reference is very interesting part quote!!): “In this work, we analyze an eruptive flare on 2017 July 13 focusing on its spatially resolved microwave emissions observed by EOVSA. Combining EUV images provided by SDO/AIA, we find that the microwave emissions are mainly from two vertically detached but closely related sources. The main strong sources are located at the flare loops with their centroids almost unchanged at different frequencies. For the second weak ones, they extend toward the direction of the filament eruption with their centroids ascending with decreasing frequency. This provides strong evidence that the microwave sources are emitted by non-thermal electrons accelerated in the close vicinity of the flare CS as found by recent observations34,37,38,40,42.

The most striking finding is that the brightness temperature and spectra for the two CS-associated microwave sources vary synchronously and present an obvious quasi-periodicity. Through wavelet analysis, we find that the main period is in the range of about 10–20 s and the second period in the range of about 30–60 s. Such periodicity is also observed in the time derivative of the spatially integrated SXR emission. The periods observed here are basically compatible with previous results obtained in other events and at different wavelengths17,61. Moreover, the similarity between the evolution of the microwave brightness temperature and the time derivative of SXR flux hints the major role of non-thermal electrons in heating the flare plasma and exciting the corresponding emissions. We also find that the optically-thin parts of the spectra tend to be flatter (harder) than those for the typical thermal GS emission45. We suggest that the quasi-periodic flare reconnection during the event drives the acceleration of the non-thermal electrons and then produces quasi-periodic microwave emissions at both the reconnection CS and the flare loops. Our 2.5-dimensional MHD numerical simulation interprets that the quasi-periodicity of the magnetic reconnection is caused by the appearance of magnetic islands within the long-stretched CS, which is further testified by the similarity between the periods of the synthetic and observed SXR emission. It is also possible that the quasi-periodic reconnection is caused by an external driver that quasi-periodically changes the reconnection inflows3,4,5,6,7, which, however, is hardly detected in the current event.

The periodicity of the QPPs we derived seems to support the interpretation of the sausage mode, which is also able to generate flare QPPs at the microwave bands via modulating the magnetic field strength and the electron density within flare loops3. Theoretically, the sausage mode can produce expansion/shrinkage of flare loops8, but which is not observable for this event even with EUV images of the high spatio-temporal resolution. Moreover, the QPP phase difference between high (optically-thin bands) and low frequencies (optically-thick bands) predicted in the MHD model62,63 is also absent (see Fig. 3a, b). Thus, we tend to exclude the possibility of sausage mode giving rise to the QPPs as detected along the CS. Of course, the sausage mode in the flare loops could leak out when its wavelength exceeds a cutoff value8. But this is essentially equivalent to external MHD waves giving rise to the quasi-periodic reconnection within the CS.

The spatially resolved EOVSA data clearly locate the sources of the flare QPPs, in particular the CS sources above the flare loops, which provides convincing evidence for quasi-periodic magnetic reconnection as a cause of quasi-periodic flare emissions. Due to the quasi-periodicity of the reconnection, electrons are accelerated quasi-periodically either in the reconnection CS or in the termination shock above the flare loop-top, later of which is driven by quasi-periodic plasma downflows42,43, and produce quasi-periodic microwave emissions at the reconnection region. As the energetic electrons are injected quasi-periodically into the flare loops, they also excite quasi-periodic microwave emissions there. Moreover, the flare also produces a group of quasi-periodic type III bursts, the peaks of which coincide well with that of the microwave emissions. This supports the speculation that energetic electrons originating from the quasi-periodic reconnection also produce quasi-periodic type III bursts once they escape from the reconnection region and propagate away from the Sun.

The separation of the two microwave sources in the eruption direction is similar to but largely different from that of double HXR sources in the corona discovered by Ramaty High Energy Solar Spectroscopic Imager observations64,65,66. In the framework of the standard flare model, the two vertically separated HXR sources are interpreted as those formed by the interactions of two oppositely directed reconnection outflows with flare loops and the erupting flux rope structure, respectively. The upper coronal HXR sources that rise with the eruption usually have softer spectra than the lower sources65. On the contrary, the microwave sources at the CS in our event do not significantly change their locations with time, and their lowest part has a harder spectral index than that of the flare-loop sources. These facts further support that the upper microwave sources are along the stretched reconnection CS with the lower tip probably corresponding to the termination shock as argued previously48.”
 
"We don't have to listen to those in the cheap seats" - Bill

"Is Adoni given to be in a “Cheap Seat”?? " - Adoni

No, Adoni and Bill together comprise "we". You and I together do not have to listen to anyone other than those I referenced.
 
Jun 11, 2023
181
8
85
Visit site
"We don't have to listen to those in the cheap seats" - Bill

"Is Adoni given to be in a “Cheap Seat”?? " - Adoni

No, Adoni and Bill together comprise "we". You and I together do not have to listen to anyone other than those I referenced.
Since I do not have a PhD): Does that mean that I cannot argue given facts to their logical conclusion??

For instance from my research and your research, can I argue/state as fact that the Earth’s Crust rises and falls/pulsates every 26 second all over the global Earth??

From my research and your expert understanding of harmonics, constructively interfered Fourier electromagnetic sine waves of a wide variety of frequencies and the generation of electromagnetic waves inside Earth at up to 9200 Kelvin can I argue/state as fact that the Earth’s Crust Rise’s and Falls every 26 seconds in a harmonic fashion because of the constructive interference of all the electromagnetic waves generated inside Earth forming “harmonic” Fourier electromagnetic sine waves that expand the space between Earth’s atoms and nucleons raising the Earth’s Crust for 13.5 seconds and crunching the entire weight of the Earth on the Earth’s core for 12.5 seconds!!

I saw no conflict with my postulates above and your reference to observation of solar Quasi-periodic pulsations (QPPs) of fractal energy radio pulsations of 20 seconds and latent (QPPs) solar fractal energy radio pulsations of 60 seconds which is why I questioned your reference as a defining countervailing authority to my postulates above!!

I understand that I did not prove the fact that our Sun has an overall QPP Solar pulsation of which the Solar QPPs that you referenced are fractal solar EM energies that constructively interfere to form our Sun’s all encompassing 5 minute and 34 second QPP!!

With respect to our Sun’s 5 minute and 34 second overall QPP Solar pulsation, I refer you to NASA as an all encompassing expert authority on this matter!!):

NASA/Marshall Solar Physics
Surface Waves and Helioseismology
5-minute Oscillations { & 34 seconds?? LOL}
Patches of the surface of the sun oscillate up and down with a typical period of about 5 minutes. The nature and source of these "5-minute oscillations" was a mystery for many years after their discovery in 1962. These oscillations are shown in the image on the left as areas of blue and red where the blue areas are moving toward us (blue-shifted) and the red areas are moving away from us (red-shifted). The fact that this signal is strongest near the center of the imaged disk of the sun and weakest near the edge indicates that the motions are primarily radial - inward and outward.
{Does the above given Sun interior oscillations prove that the Earth's 26 second oscillations are, also, primarily in and out?? and harmonic?? LOL I'm sooooo very silly!!}

A movie (3.7Mb MPEG) constructed from a series of these images (taken at the rate of one per minute for 150 minutes with the GONG network instruments) shows how individual patches are blue-shifted and then red-shifted through several cycles. The result is an apparent chaotic vibration of the sun.

p-Modes
The mysterious source of these oscillations was identified by way of theoretical arguments in 1970 and confirmed by observations in 1975. The oscillations we see on the surface are due to sound waves generated and trapped inside the sun. Sound waves are produced by pressure fluctuations in the turbulent convective motions of the sun's interior. As the waves move outward they reflect off of the sun's surface (the photosphere) where the density and pressure decrease rapidly. Inward moving waves are refracted (their direction of motion bent) by the increase in the speed of sound as the temperature increases and eventually return to the surface. These trapped sound waves set the sun vibrating in millions of different patterns or modes (3.7 Mb MPEG movie). Since sound is produced by pressure, these modes of vibration are called p-modes. One mode of vibration is shown in the image above as a pattern of surface displacements exaggerated by over 1000 times. A movie (1Mb MPEG without audio, 6.5 Mb MPEG version with audio) shows how this mode of oscillation consists of two oppositely moving waves.

Helioseismology
These sound waves, and the modes of vibration they produce, can be used to probe the interior of the sun the same way that geologists uses seismic waves from earthquakes to probe the inside of the earth. Some of these waves travel right through the center of the sun. Others are bent back toward the surface at shallow depths. Helioseismologists can use the properties of these waves to determine the temperature, density, composition, and motion of the interior of the sun. A number of fascinating discoveries have been made in the last few years using the science of helioseismology. The image above (from M. J. Thompson) shows the internal rotation rate of the sun with red for fast and blue for slow. The variation we see at the surface between the equator and the poles extends inward and then rapidly disappears at the base of the convection zone (shown by the dashed line).

Secondary Source "Fractal" Solar Pulsations): Published May 23, 2019 By Dr Eoin Carley): Research Fellow, Trinity College Dublin & the Dublin Institute for Advanced Studies

Radio observations reveal the origin of pulsating light from the Sun.

The solar atmosphere produces the most powerful explosions in the solar system, often associated with pulsating radio emission.

However, the cause of the pulsations is a modern enigma in solar physics.

In a recent Nature Communications article, we use a combination of radio imaging-spectroscopy and magnetic field modelling to uncover the origins of this periodic radio signal from the Sun.

Have a great day!!
 
Last edited:
I have provided the latest peer reviewed work on each of these issues. You are free to accept or reject it. I do not care to hear any other explanations as it would overload my 71 year old brain. As I have told others: I do not understand the conventional theories well enough to spot errors in other people's theories therefore I am not going to consider any "out of the mainstream" ideas. Sometimes I will point out errors but that's about it. I work only on one theory at a time. I always choose the latest peer reviewed research papers by PhD's working in their field and associated with a university. I can only try and understand one explanation at a time. If you want me to listen to your theories, get them into the peer reviewed literature and I'll be happy to consider them.
 
  • Like
Reactions: Adoni Yannop
Jun 11, 2023
181
8
85
Visit site
I have provided the latest peer reviewed work on each of these issues. You are free to accept or reject it. I do not care to hear any other explanations as it would overload my 71 year old brain. As I have told others: I do not understand the conventional theories well enough to spot errors in other people's theories therefore I am not going to consider any "out of the mainstream" ideas. Sometimes I will point out errors but that's about it. I work only on one theory at a time. I always choose the latest peer reviewed research papers by PhD's working in their field and associated with a university. I can only try and understand one explanation at a time. If you want me to listen to your theories, get them into the peer reviewed literature and I'll be happy to consider them.
Cool!! I, also, have a 71 year old brain!! Have A Great Day, Bill!!
 
  • Like
Reactions: billslugg
Jun 11, 2023
181
8
85
Visit site
Sorry I misstated that. An accelerating emitter has a different frequency on each emission........a chirp emission.

The frequency is defined as one on time and one off time. This is duty cycle frequency.

In a hay field, if the tractor is going at a constant velocity, The frequency would be the length of the bale....plus the space to the next bale.

Therefore.....if tractor is at same speed, space between bales will be equal. AND can be adjusted and set by tractor speed. If tractor goes slow, little space between bales. if tractor goes fast, large space between bales.

IF the tractor is accelerating.....each sequential space will be longer.......and if tractor is decelerating....each sequential space will be shorter. Chirping.
Your tractor bailing hay analogy intrigues me!! First, if it was for real wouldn’t the tractor/baler consume energy!!

I suggest a gaseous GP1 Aether Particle medium under pressure for electromagnetic waves because electromagnetic waves have all the properties of sound waves and sound waves are given to propagate in a gaseous air particle medium under pressure and similar results must have similar origins, I conclude that electromagnetic waves must propagate in an invisible gaseous medium!!

But because of the Michelson-Morley experiments of the 1890’s light waves are given to propagate miraculously in “empty space” {in nothing??} as something massless with momentum??

So, any ideas on how I can get some traction on my theory that electromagnetic waves travel as alternating beads high GP1 Aether Particle Pressure (+) and low GP1 Aether Particle Pressure (-)??
 
The tractor and the baler represent a star. Lots of energy. The hay bales represents intermittent duty cycle light.

Deep red shifts are from duty cycle shift, not sine wave shift. High velocities stars and/or expanding space is not needed to explain these shifts.
 
Jun 11, 2023
181
8
85
Visit site
The tractor and the baler represent a star. Lots of energy. The hay bales represents intermittent duty cycle light.

Deep red shifts are from duty cycle shift, not sine wave shift. High velocities stars and/or expanding space is not needed to explain these shifts.
While I agree with you and Edwin Hubble himself that the Hubble Flow Redshift/The Cosmological Redshift is not Doppler redshift and that galaxies are not moving away from us by the alleged dark energy's/perpetual energy's expansion of space at up to superluminal speeds as the galaxies themselves are given to be "physically" standing, still, I argue that the observed cosmological redshift is, merely, directly related to the distance that the light traveled from its source to us and that the reduction in amplitude as the square of the distance as the light waves travel to us in a GP1 Aether Particle Medium is the main culprit in the cosmological redshift observed!!

More on the natural "baling" of GP1s into high and low pressure beads later today.

I'm back!!): While the natural "baling" of GP1 Aether Particles to alternating high and low GP1 Aether Particle Pressure Beads would be more of a three dimensional sine wave than your suggested light/EM duty cycle not requiring high velocity stars/galaxies and/or expanding space to explain the Hubble Flow/Cosmological redshift); space cannot expand between galaxies without the galaxies physically and actually moving apart as falsely given!!

In 2017, the DiPole RePeller Group discovered that the DiPole RePeller Void is pushing our local galactic group and all of the Virgo Centric M87 Supercluster towards the Shapley and Great Attractors at 290 km as the Shapley and Great Attractors are pulling us at 341 km/s towards the Shapley and Great Attractors!!

Just Google): Dipole Repeller Video and scroll down to 04:24 Minute Dipole Repeller Video to check it out!! or right click link and open): The Dipole Repeller

Wiki): The dipole repeller is a center of effective repulsion in the large-scale flow of galaxies in the neighborhood of the Milky Way, first detected in 2017.

It is thought to represent a large supervoid, the Dipole Repeller Void. The dipole repeller is directly opposed to the Shapley Attractor, an over-density of galaxies … See more

Discovery): The Local Group of galaxies is moving relative to the cosmic microwave background (CMB) at 631±20 km/s.
There is also a pattern of bulk flow in the motion of… See more

Controversy about the Dipole Repeller and its 'repulsive force'

Nevertheless, the discovery of the Dipole Repeller was commented on by astrophysicists and journalists in the mainstream media … ): The Dipole Repeller Film produced as part of the publication: "The Dipole Repeller" by Yehuda Hoffman, Daniel Pomarède, R. Brent Tully, and Hélène Courtois, Nature Astronomy 1, 0036 (2017).

Talk more, soon!! Have a great day!!
 
Last edited:

Latest posts