David,
What I mean, is that you replace contour lines of (for example) equal height, with lines joining points of (say) 0 and 50 feet elevation. Thus you keep your contours, indicating 0 and 50 feet (
as faint construction lines) and join points on them.
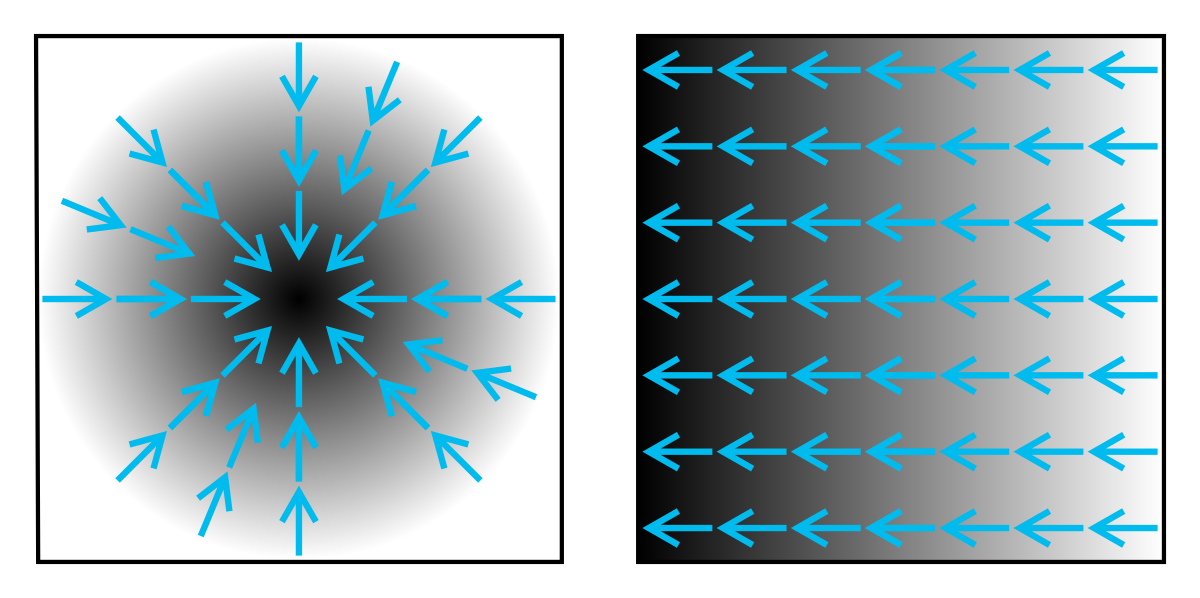
If you think about it, if the slope is gentle, it is a long distance between 0 and 50 feet. If it is steep, then the 0 and 50 points are close together. In a cliff, the contours (and the lines between them) are very close/short.
Of course you can do just this, giving an
artistic version of a contour map, and you may already have seen such.
Why then do this at all?
Well, with ordinary contour maps, the height points are fixed and easily measurable. I am suggesting that it might be useful to adopt this where the points are not fixed (as in heights) but variable as in quantum variations described. Here, the points do not represent heights, but variation limits. If the "contours" are close together, this signifies little variation; conversely, "contours" far apart signify wide limits.
It is the same principle as drawing two parallel lines on a graph to show the limits in one variable against another. For example, take wave height. When graphed against another variable (tides, for example) one line might represent wave height at high tide, the other at low tide.
I was just trying to suggest a way of representing variations which might occur in a quantum (probability) context, as compared with measurable variables at normal levels.
This method may already be well known - it is just that I have not come up with it.
Cat


